
Data
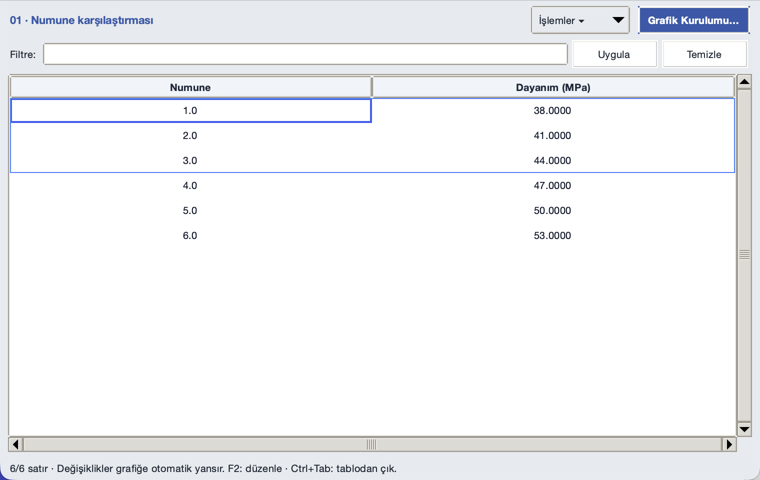
Spreadsheet-oriented input
Work with CSV and Excel sources, including multi-sheet scientific datasets and tabular editing workflows.
A desktop application for building publication-oriented scientific figures from CSV, XLS, and XLSX data, with analysis, fitting, multi-panel layout, and export workflows.
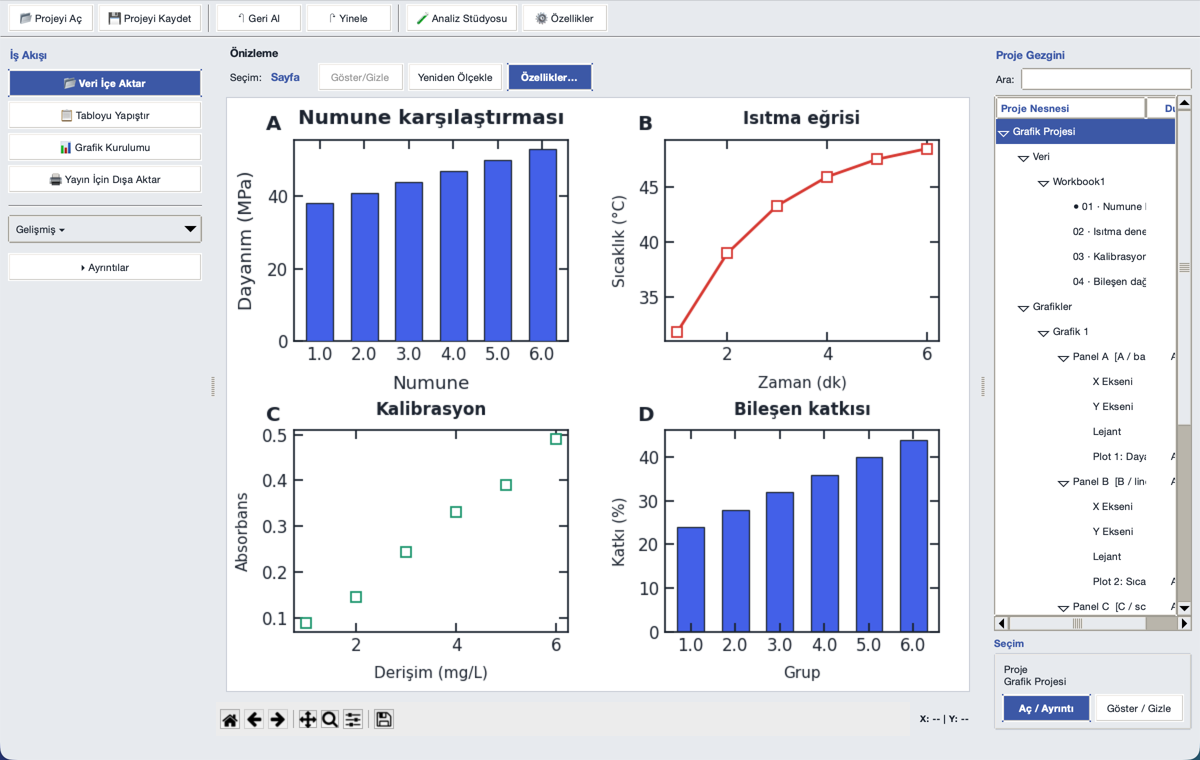
Work with CSV and Excel sources, including multi-sheet scientific datasets and tabular editing workflows.
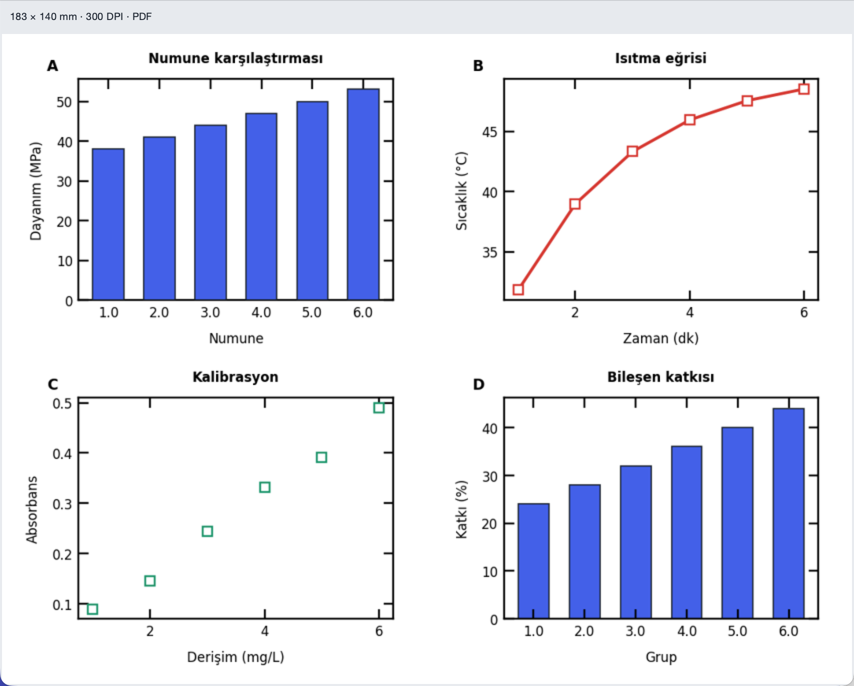
Create line, scatter, bar, error-bar, dual-axis, multi-layer, and multi-panel scientific figures.
Export exact-size figures with editable vector text in PDF/SVG and controlled raster output.
The interface keeps data, figure construction, analysis, and publication output connected without hiding advanced controls.
Load CSV/XLS/XLSX files or paste tabular data into a project-oriented workflow.
Build plots by worksheet, columns, panel, and plot kind while preserving data identities.
Use fitting and analysis tools alongside axis, legend, error-bar, and annotation controls.
Prepare publication-oriented PDF, SVG, and raster outputs with explicit sizing and preview.
The examples below are taken from the current Scientific Graph Studio repository.
The codebase includes automated tests, audit documentation, atomic project-writing behavior, stable data-column identities, and dedicated Windows packaging checks.
The v7.1 audit documents a verified test run with 239 tests and no skipped audit tests.
Project writes are atomic and source changes can mark stored results stale instead of silently rebinding data.
The v7.2 codebase includes tested Windows 10/11 x64 packaging and release-gate workflows.